

This report documents the transition of n3m0 the autonomous boat, originally a monohull designed for long-ish range water-quality measuring missions, to n3m02 the autonomous catamaran. The mission was to add a depth sensor to the boat so that it could survey the harbor at Cal Maritime. The harbor silts in pretty quickly and it is an expensive and time-consuming process to dredge, so keeping tabs on the depth over time was the goal. A transom-mount NMEA-1083 speed/depth/temperature transducer was added to the boat, and a raspberry pi was used to log the position of the boat from the autopilot and the depth from the sensor. The data was uploaded in real time to github, which worked quite well! Eventually a second hull was added to allow differential thrust and improve maneuverability when running next to docks and moored vessels. Read on for more information!
Monohull Mods for Depth Surveys

The transom mount sensor (Airmar P66) was easy to add. It was attached with some 3D printed brackets, and powered from the 3S lipo battery on the boat. A raspberry pi replaced the payload computer from the first version of n3m0. The depth sensor was wired up to the raspberry pi through a USB-Serial adapter. The pi was also wired to a serial port on the autopilot so it could receive mavlink telemetry messages. A separate 5V DC-DC converter was added to power the pi from the motor battery. Some details on using a mobile data link can be found here. The innards are shown in the photo below.

Real-time Data Updates to Github
For a mission, waypoints that covered the harbor were created. While the boat followed the path, the python code on the pi logged each depth measurement (the NMEA sensor uses the standard 1 Hz update rate) along with the corresponding measurements of time, position, speed (GPS and water), heading (GPS and magnetic), and water temperature. Also the tide height at the closest station to the boat was found for the measurement’s time stamp using a tide-prediction website and was added to the log for proper charting.
The data was logged into a geojson format file, and periodically the code would commit the data directory to github (data archive link– beware there are many bench tests included in the archive). Geojson is a nice text-based file format that is rendered into a map preview automatically by github, so the data can be monitored while the boat takes its measurements, and geojson files are easy to import into most GIS software packages. Github is a great place to store citizen-science data, as it is easy to access, easy for anyone to make contributions, and easy to track where the data has originated and any changes made. The code used on the pi can be found at github as well, of course.
Monohull Results

The system worked pretty well! Surveys were done of the Cal Maritime harbor (shown) as well as Richmond Yacht Club and Newhall lake. The geojson files were processed with the QGIS software to produce images like the one above.
Problems and Hassles
A few issues came up from testing.
- Poor Steering: the transom-mount sensor worked as a very effective rudder, fixed in the straight-ahead position. The boat’s steering was sluggish and it was difficult to navigate next to docks and moored boats without bumping into them. This is the main reason for the catamaran conversion. See the path in the harbor above for the turning radius (larger than the space between survey tracks)
- Complex Operations: to run the boat required tracking many items. However as more confidence in the system was acquired less monitoring of the automatic navigation and logging was required. These are the tasks for running n3m0 on a depth survey mission:
- Watch for traffic and operate the manual transmitter if needed to avoid other boats
- Watch the ground control station and monitor the mission and boat status (battery, GPS, etc)
- Watch the raspberry pi terminal for messages from the logging system
- Check the github data as it is archived
- Maintain local wifi (phone hotspot usually). Wifi was needed for the boat to upload to github and get tide station information. The boat needed wifi on startup for the tide data; the github data would upload whenever the wifi signal was present, and store data locally otherwise, so for most missions the github archive would update when the boat was close to the operator and upon return at the end of the mission.
- 1 Hz Sensor: the depth sensor has a 1 Hz update rate. At this rate one must assume that the sensor signal is heavily filtered (and therefore laggy) in order to satisfy the sampling theorem. The navigation data has a much higher sample rate, with correspondingly lower lag. I noticed that when running a back-and-forth path, measurements that were taken in opposite directions did not match up as one would expect, even at a slow survey speed of 1 m/s (about 2 kt). As the boat went from deep to shallow water, the measurements seemed deeper than when going from shallow to deep (indicating depth data lagging position data). Tracks in the same direction match better than tracks in opposite directions. See the image below in a very shallow lake (so the angle of the sensor is unlikely to be an issue). The solution to this would be a faster sensor (or perhaps careful filtering of the location data to match the depth?). More tests are needed to fully understand this effect.


Catamaran Transformation
The monohull n3m0 could not turn tightly enough to reliably run next to docks and moored vessels in harbor surveys. In order to address this, a second hull was added to transform n3m0 into a catamaran (named n3m02). The catamaran configuration could use differential thrust to make sharp turns at low speed or even pivot while stopped. Dual rudders (one on each hull) were kept from the monohull design, because differential thrust for steering fails if one hull’s propeller comes out of the water on a wave, and in this case the rudders will provide additional steering. The hulls were connected with carbon fiber tubes and 3D printed mounts; wires were pulled through the tubes to connect the electronics and mechanics.
The depth sensor was also glued to the middle of one hull with a large epoxy fillet, while the speed paddlewheel was removed. This helped the trim of the vessel which was very aft-heavy as a monohull.

Overall the catamaran version of the boat has been successful! It achieved the desired maneuverability with only a small increase in size. It is still small enough for a single person to launch and retrieve, and will easily fit in a car.
The lag in the depth signal was never fully investigated or resolved, and this would be highly recommended if the boat is to be used for harbor surveys in the future. But n3m02 has been reconfigured once again, this time to measure tidal current and drift!
A New Mission
In Fall 2024 your author was granted sabbatical leave, in order to work on a project that uses an autonomous boat to measure surface current by drifting. N3m02 is the test rig for this new mission, and has been updated with a new autopilot (to allow ardupilot Lua scripting) and new telemetry hardware (ELRS mavlink). The raspberry pi and its need for extra monitoring and wifi was removed, with all data logging done via lua scripts on the autopilot itself and saved to the autpilot’s onboard SD card. More information will come in a separate article- I will update this one with a link when that happens.
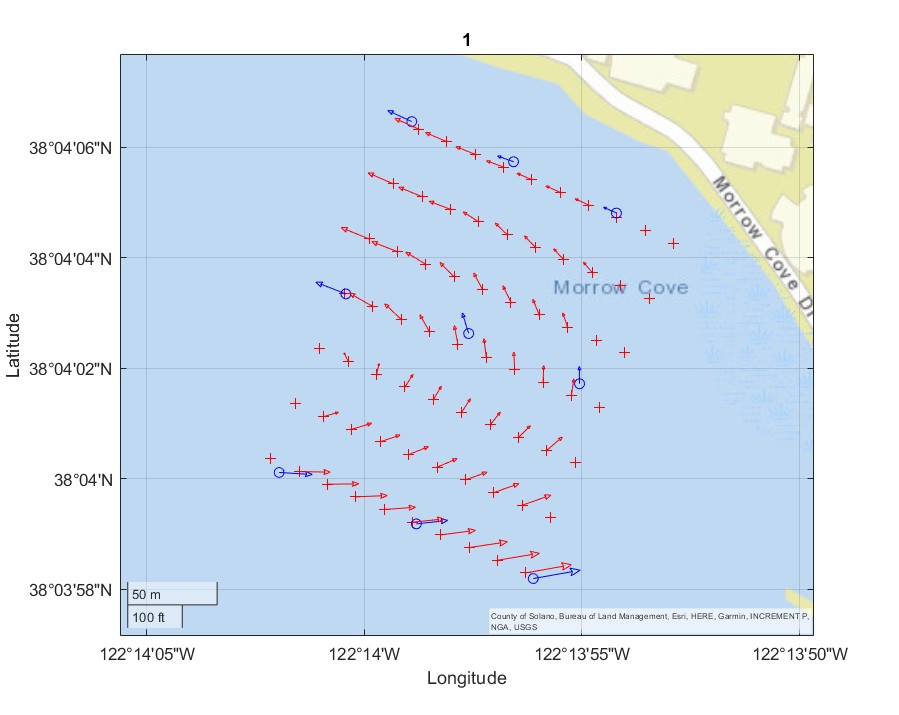
Here is a teaser update of some drift measurements. The boat went to 9 waypoints (shown as blue circles) and drifted for one minute. The drift velocity is shown as blue arrows. The red arrows are interpolation of the drift measurements into a velocity field for route optimization. Morrow cove can have a strong eddy current as you can see! The near-shore current is in the ebb direction while the measurements towards the middle of the channel show flood.
One thought on “n3m02 the Autonomous Boat: Depth Surveys”